Skip to main content Skip to search Skip to main navigation

Measure inbreeding – preserve diversity

The art of modern, DNA-assisted animal breeding lies in keeping inbreeding and diversity in balance while still moving closer to your breeding goals. Pedigree-based calculations of an inbreeding coefficient (IC) are not suited to this. And it is not only in breeding that an inbreeding-and-diversity assessment from Generatio delivers valuable information – even in supposedly better-positioned mixed-breeds, studies often reveal pronounced manifestations of inbreeding. Here, too, a genome-based assessment is the way to judge the situation correctly.

The right method

For the „Inbreeding and Diversity" test we examine the animal's DNA with so-called SNP arrays („SNP chips"). These chips carry many tens of thousands of genetic markers, evenly distributed across the entire genome. What matters is the marker spacing: the finer the resolution, the more reliably the whole genome is represented. The right choice depends on the species – more precisely, on the level of inbreeding typical for it.

High Density Array

Dogs

Dog breeds were established and further developed through intensive inbreeding in the past – individual inbreeding levels are often above 20 %. Our high-resolution SNP array chip with around 173,000 SNPs can also detect older, long-past inbreeding and factor it into mating assessments.

Order the test for dogs
Medium to High Density Array

Horses

In horses the average degree of inbreeding is considerably lower than in dogs – owing to the long generation intervals and the fact that only a single foal is born at a time. Our horse array covers around 81,000 SNP markers and delivers very good results for individual and mating assessments.

Order the test for horses
Medium Density Array

Camelids

Camelids – dromedaries, Bactrian camels, alpacas and llamas – have developed largely without inbreeding across populations. The available arrays with around 55,000 SNPs are very well suited to assessing possible inbred matings and to building a breeding strategy for specific traits.

Order the test for dromedary / Bactrian camel

Components of a complete analysis

A robust inbreeding-and-diversity assessment succeeds with a whole-genome evaluation using an SNP array of the right resolution. This analysis then delivers three components for the individual assessment of an animal and as the basis for mating planning.

ROH

I) Runs of Homozygosity

The ROH analysis localises where inbreeding is present in the genome and how extensive it is. The term comes from the analysis itself, which identifies the DNA segments ('runs') that are identical on both chromosomes (=homozygous) as a result of common ancestors.

ROH in the glossary
gIC (FROH)

II) Genomic inbreeding coefficient

The genomic inbreeding coefficient is calculated as the sum of all ROH relative to the size of the whole genome evaluated. A gIC quantifies the total extent of an animal's inbreeding in a single value.

gIC in the glossary
HE

III) Genomic heterozygosity

The genomic heterozygosity value describes the proportion of all markers present in heterozygous form relative to the size of the whole genome evaluated. The HE value is regarded as an indication of variability and adaptability/fitness.

HE in the glossary

Using the findings – individual animal

The ROH profile shows the essence of genome-based inbreeding analysis most vividly and reveals what other methods cannot. Using the examples below, you will see how individual situations reveal themselves in the respective ROH patterns. The overall gIC and HE values complete the finding.

read moreshow less

As a general rule, for populations with low average inbreeding: recent inbreeding events show up as extended ROH – for example from an inbred mating of parents or grandparents.

Shorter ROH point to inbreeding that lies several generations back.
In strongly inbred populations, in turn, very extended ROH arise from the accumulation of many inbreeding events.

Important: the location and extent of the individual ROH are unique to each animal. Through random recombination, even siblings show variations that lead to different locations and extents of the ROH – which can be exploited in breeding.

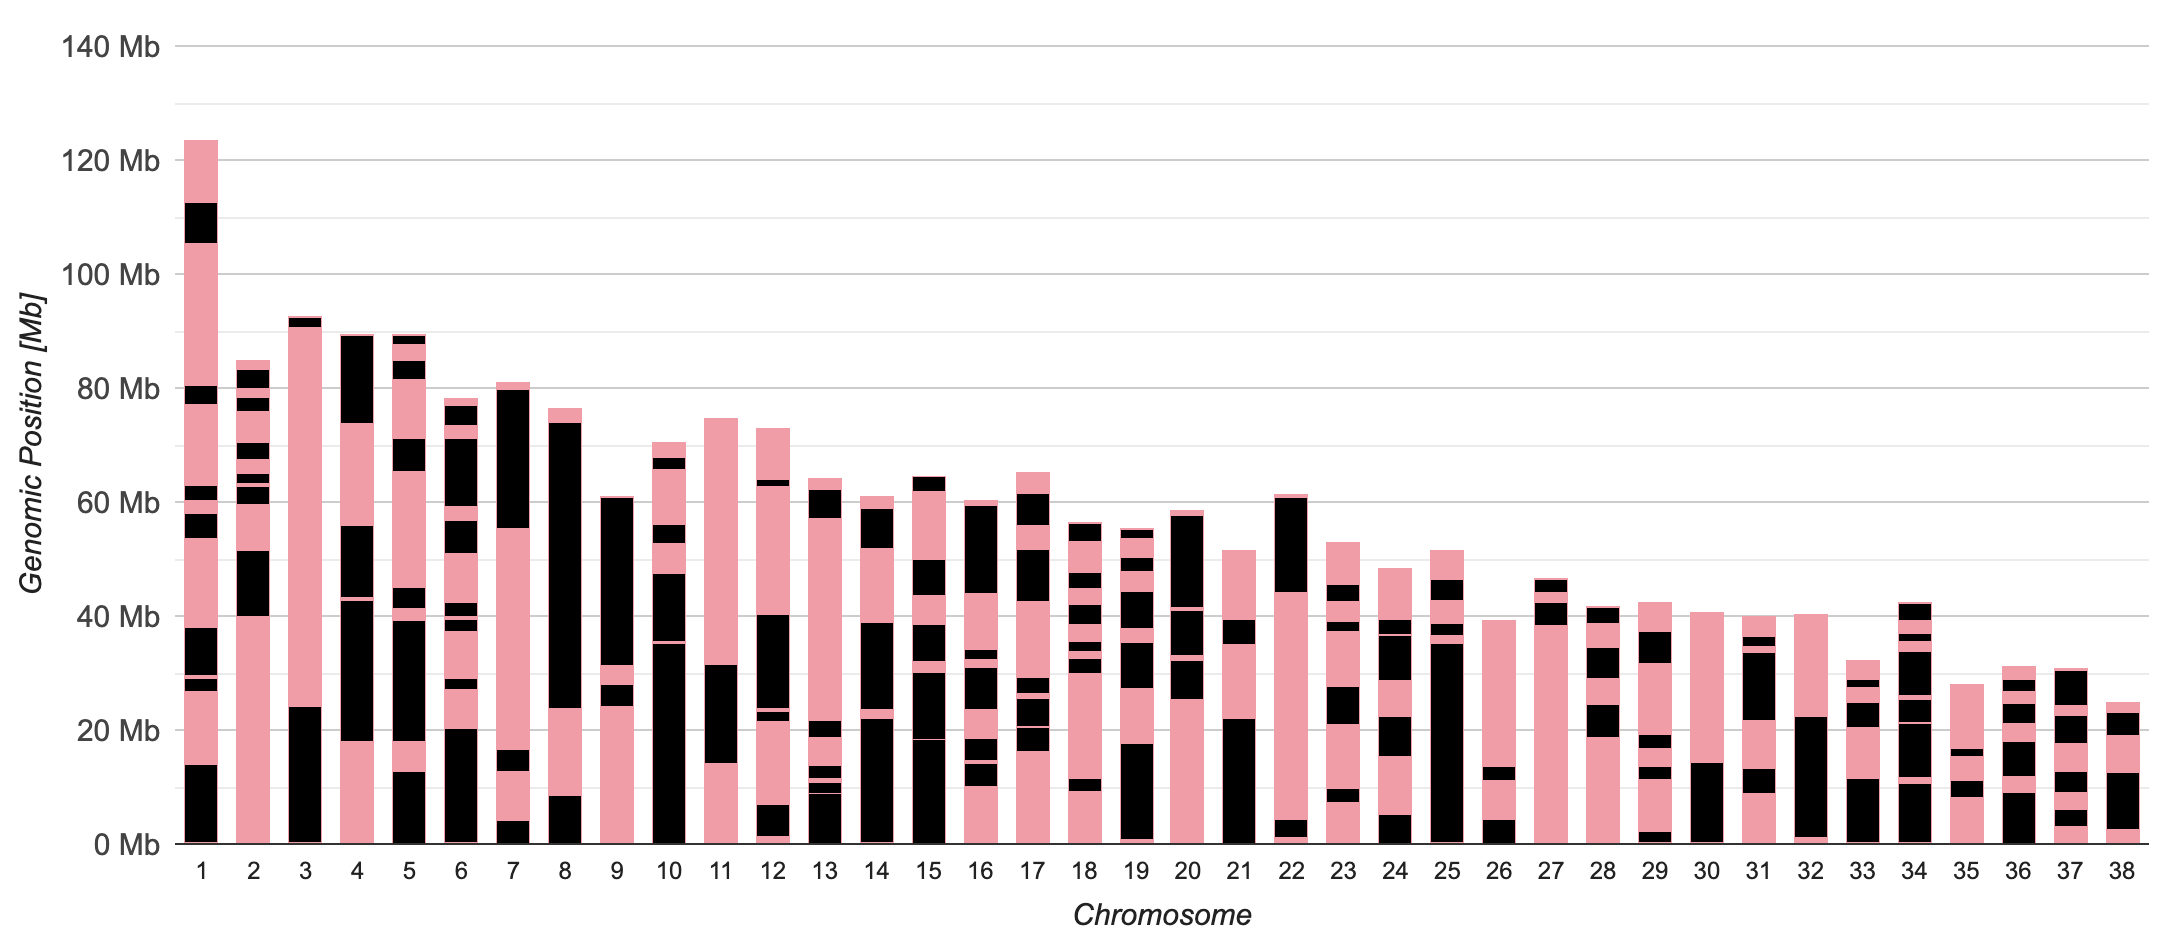
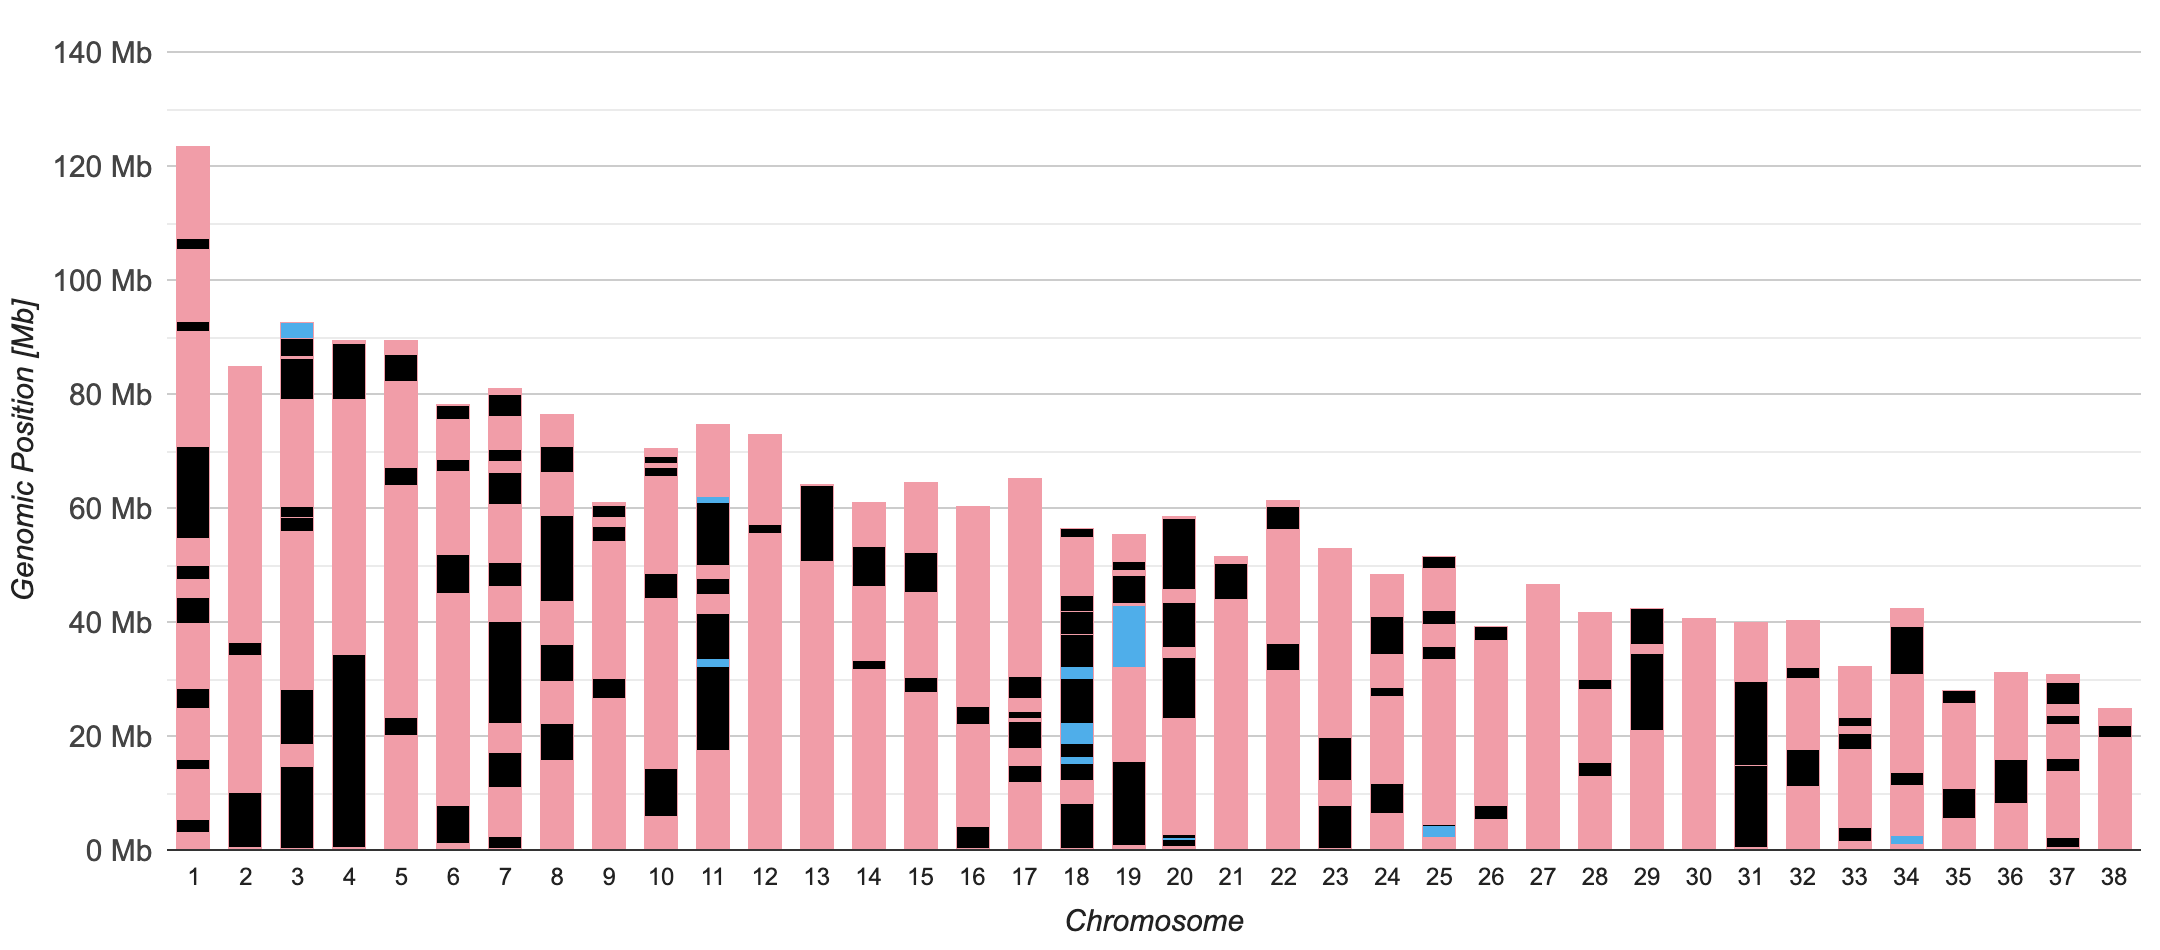
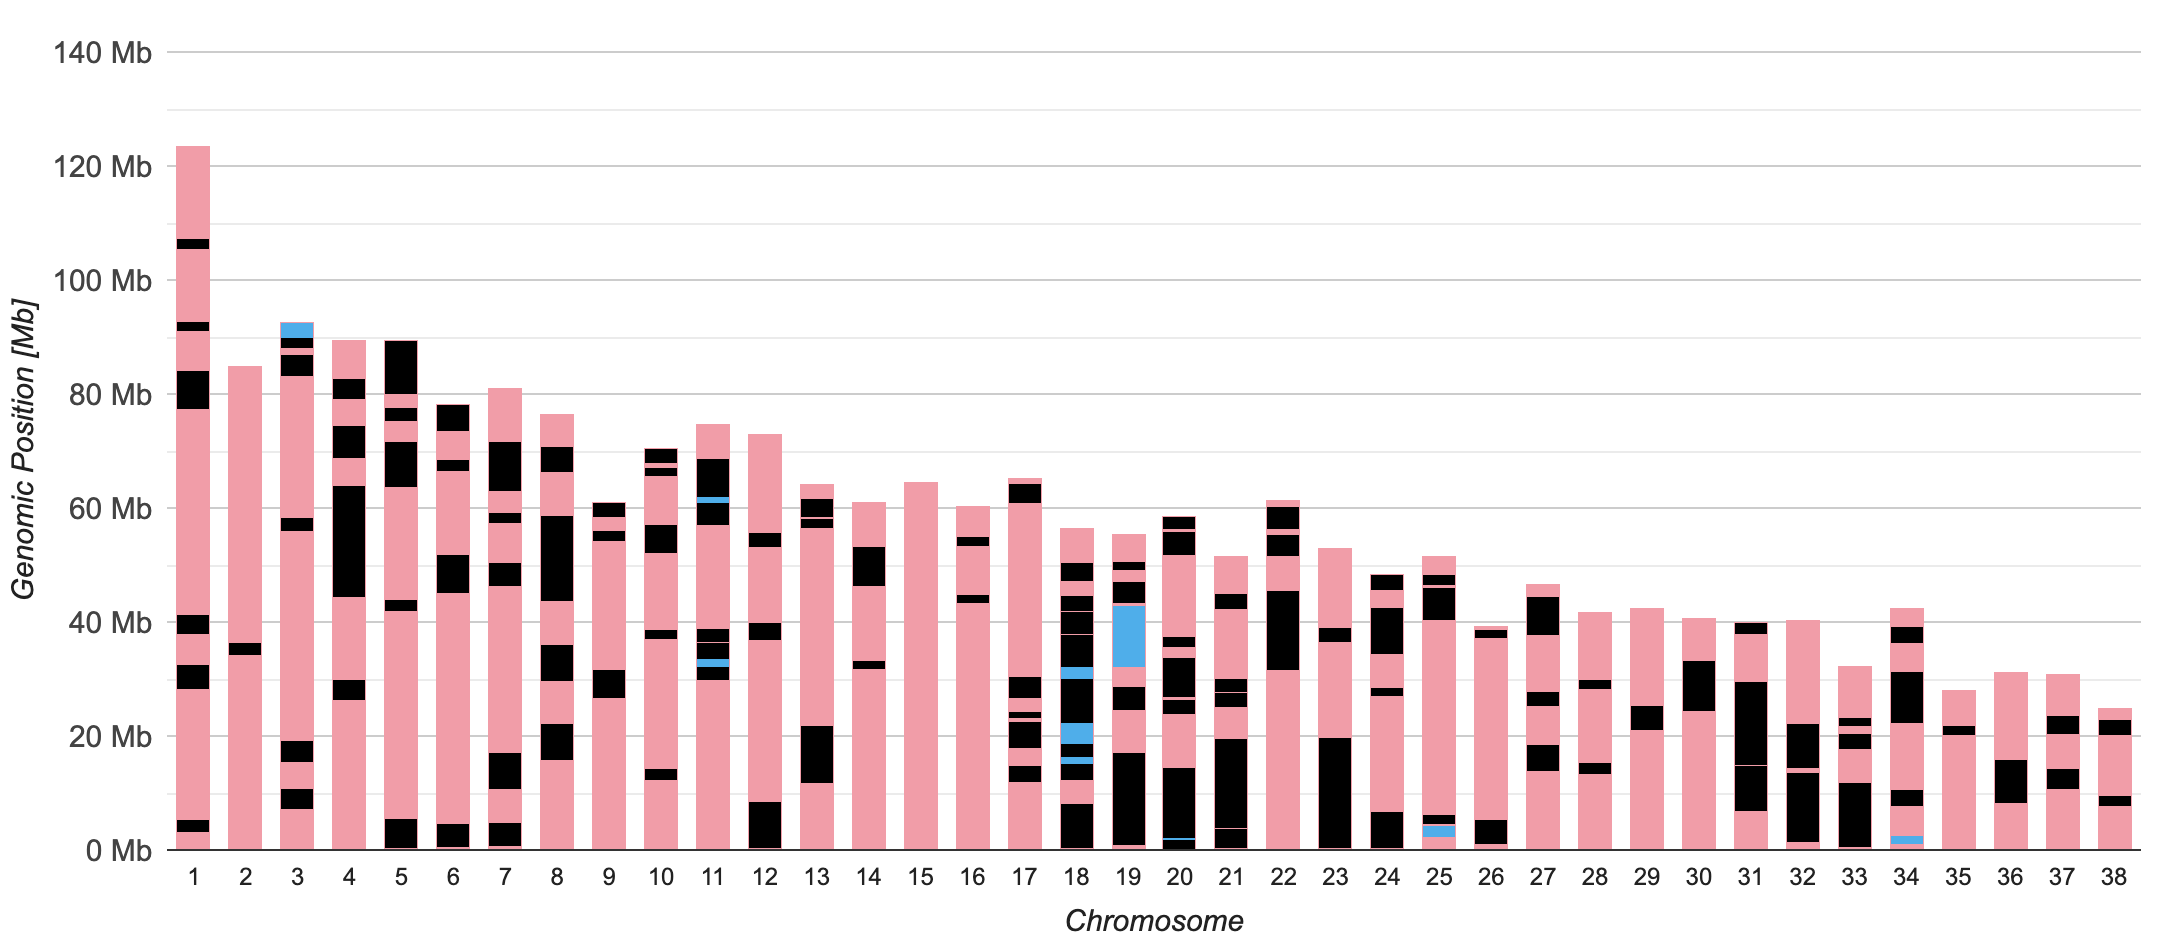
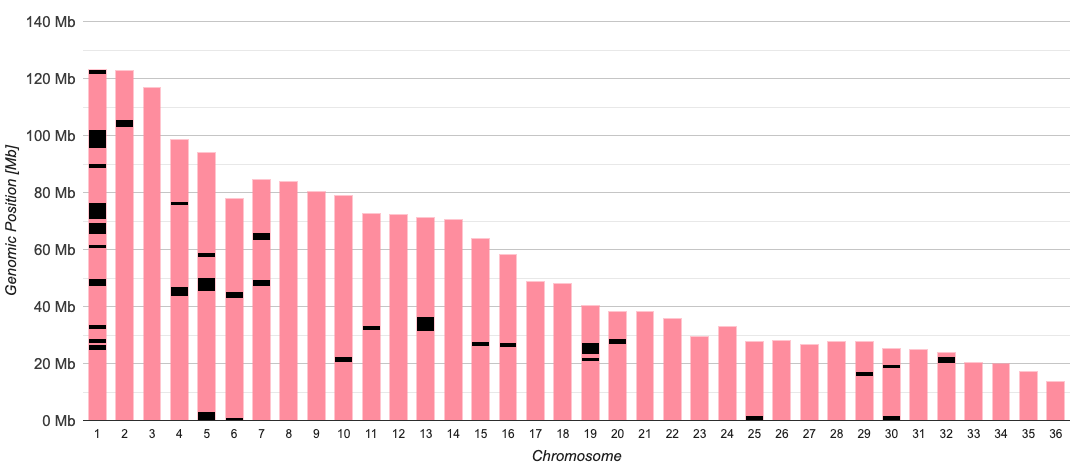
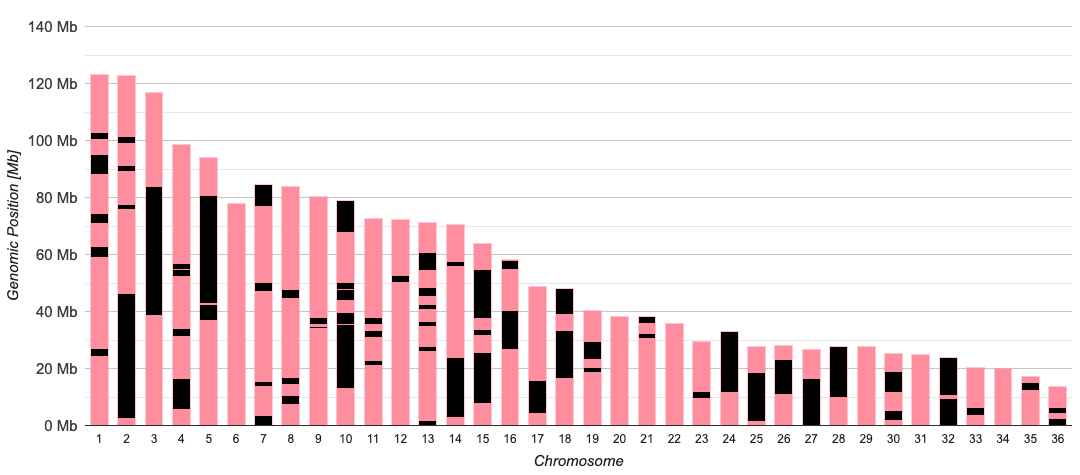
How to read the ROH profiles:
  • Pink – chromosome: total extent; number and size vary by species
  • Black – ROH: location and extent
  • Blue – ROH islands: breed-defining ROH (only available for some dog breeds)

Four examples show how ROH, gIC and HE values can be read for an individual animal:

A

Camel – low inbreeding

ROH profile of a camel with only isolated, short homozygous (black) ROH segments across the chromosomes – low inbreeding, gIC 4%
B

Camel (dromedary) – inbred mating

ROH profile of a camel from an inbred mating with few but long homozygous ROH segments – recent inbreeding, gIC 27%
C

Dog – extreme inbreeding

ROH profile of a dog with extensive homozygous ROH segments across many chromosomes – extreme inbreeding, gIC 45%
D

Two dog siblings – same gIC, different pattern

both gIC 27 %Population mean gIC 30 % · HE 24 %
Sibling 1 · gIC 27 %
ROH profile of dog sibling 1 with an individual pattern of homozygous ROH segments – gIC 27%
Sibling 2 · gIC 27 %
ROH profile of dog sibling 2 with a different pattern of homozygous ROH segments at the same gIC 27%

Both siblings have the same gIC of 27 % – and yet completely different ROH patterns. Through random recombination the homozygous segments lie in entirely different parts of the genome. The gIC value alone therefore says nothing about which parts of the genome are affected.

Inbreeding control & preserving diversity

Our solutions for genome-based mating planning are suitable both for the individual matings of hobby breeders and for integrated use in large studbooks.

The advantage of using ROH profiles: they make it possible to find a suitable candidate for every animal.

In terms of inbreeding control there are no good and bad animals – only bad matings and good matings.

Bad matings lead to an increase in inbreeding in the offspring; good matings improve the health prognosis of the offspring and reduce the level of inbreeding in the population.

Which strategies are possible depends on the availability of individual-animal assessments.

Example 1

Breeding club with existing individual assessments of all sires

In this situation there are two approaches:

Ranking first

For a dam, a ranking is drawn up that maps the mating assessments of all available sires. From the list you can check which sires show a positive inbreeding prognosis. The breeder decides to what extent, alongside general health criteria, further breeding criteria are applied.

Breeding criteria first

The candidate sires are pre-selected by health and standard breeding criteria and then matched against the dam for genomic similarity. You decide whether to take the inbreeding-development prognosis into account.

Example 2

Individual breeder aiming for inbreeding control

Because all the required information can be obtained directly from the individual animals, our approach is ideal for building effective inbreeding control as an independent breeder.

All animals intended for breeding need an individual assessment – we prepare the pairwise assessments for all possible combinations, and the breeder decides which mating is actually carried out.

Example of a genome-based mating assessment

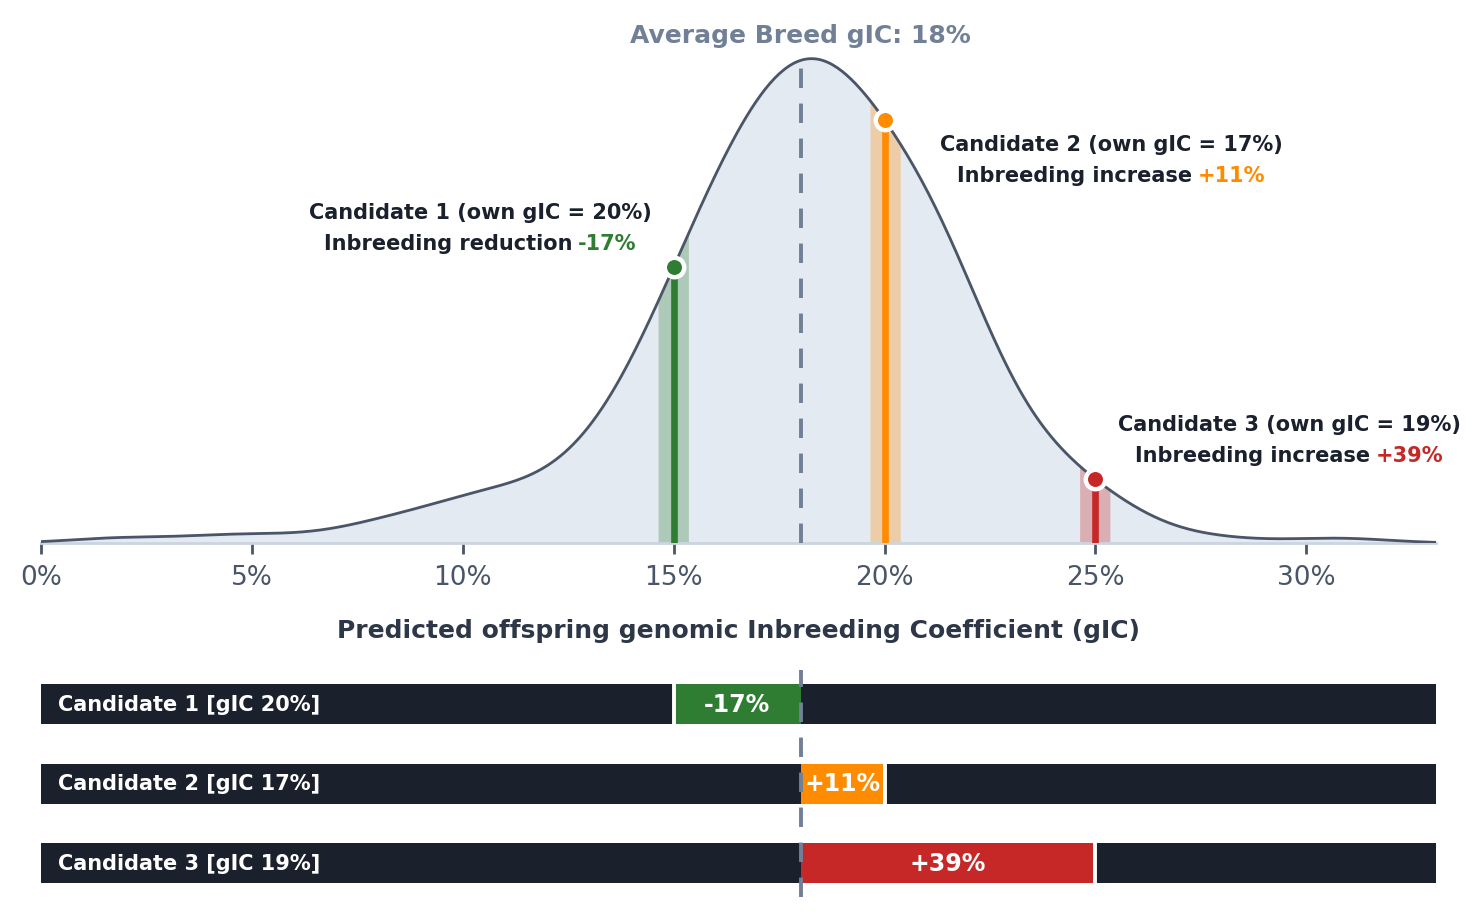
Starting point: a bitch with an individual gIC of 19%. Three candidate sires are to be assessed for their potential to improve the inbreeding situation.

Two-part figure: top, the distribution curve of the breed's inbreeding values with an average gIC of 18% and the predicted offspring gIC for three candidate sires (own gIC 20, 17 and 19%) at 15, 20 and 25%; bottom, one bar per candidate showing the change relative to the breed average: Candidate 1 −17% (green, inbreeding reduction), Candidate 2 +11% (orange) and Candidate 3 +39% (red, both inbreeding increase).
Top: distribution of the breed gIC with the predicted offspring gIC per candidate. Bottom: the change in inbreeding for each mating, shown as deviation from the breed average (green/left = reduction, orange/red = increase).

Can't Find What You're Looking For?

You'll find answers to many common questions in our FAQ section.

Go to FAQs

Can't Find What You're Looking For?

You'll find answers to many common questions in our FAQ section.

Go to FAQs