Skip to main content Skip to search Skip to main navigation
Knowledge · Pro Line Dog

Breed analysis – finding the potential for your breeding

Modern DNA-analytical methods such as breed analysis by Generatio can measure to what extent a dog attributed to a particular breed actually carries the genomic components typical of that breed.

In breeding planning, the analysis makes it possible to identify dogs from other subpopulations that meet the breed standard in appearance and additionally carry genomic components that can enrich your own population.

„Breed" – a term without a sharp definition

There is no generally accepted definition of „breed"; the term is nonetheless widely used to classify dogs and other populations.
For the current systematics of dogs the most important body is the FCI; the Vertebrate Breed Ontology portal of the EMBL-EBI is also very helpful.

Zoological systematics

The global taxonomy of dog breeds

According to the FAO, a breed is a sub-specific group of animals with definable and identifiable external characteristics that permit visual appraisal (> phenotype) and separation from similarly defined groups. Which characteristics these are in each case, and how they are assessed, is not regulated and remains fluid.
Organised dog breeding

The studbook solution

A dog belongs to a breed if it is entered in that breed’s studbook and its parents were. For admission, the parents undergo a phenotype assessment. The breeding organisation and its studbook define membership, not the genome. DNA-based parentage verification supports the correctness of the studbook entry.

Breeders outside any association

Self-declaration

Dog breeding outside any association is not regulated. The individual breeder alone decides which breed name to assign. Depending on their focus, some follow the recognised breed clubs of the breed in question; others have specialised in breeding hybrids, or set out to realise their own conception of a particular breed.

Source

  • FAO: The future of the breed concept. Part 3, Section C, in: The State of the World’s Animal Genetic Resources for Food and Agriculture (Third Report). FAO, Rome. Contains the FAO working definition of 1999. fao.org

The same breed, different subpopulations

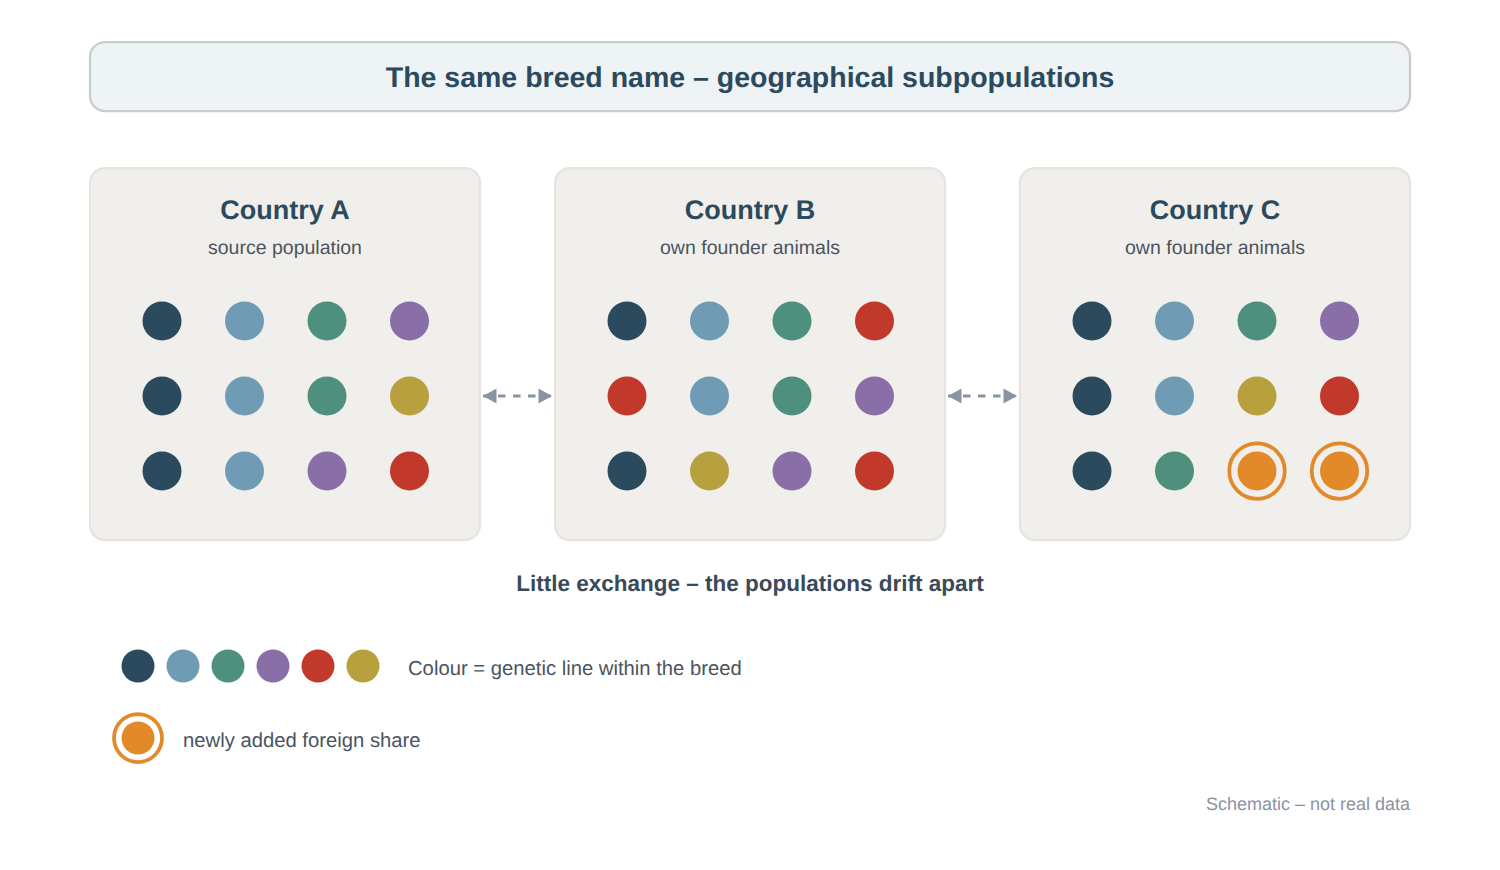
Whether Great Dane, German Shepherd or Chihuahua: only a few specific gene variants underlie the manifold dog breeds – for most traits studied, no more than three loci explain the bulk of the variation. The specific genomic background arises above all from the restriction to selected breeding animals in closed studbooks. When an already established breed is bred on with animals kept apart by geography, regulations or working purpose, their differences give rise to subpopulations of their own. Breed analysis can uncover those differences and make them usable.

Three country populations of the same dog breed with twelve dogs each. The source population in country A carries six genetic lines, the red one in a single dog. In country B the red line is present three times, while one dark blue and one grey-blue dog are missing. In country C two dogs additionally carry a newly added foreign share shown in orange. There is barely any gene flow between the populations.
Each population keeps a different subset of the breed’s diversity – what is lost in one country may still be held in another. In country C a foreign share has additionally been added. Schematic, not real data.
Founder effect

The start shapes everything

Where a breed is established in a country from a handful of imported dogs, that population carries only part of the breed’s diversity from the outset. Founder effects account for much of the differentiation measurable today between populations on different continents.

Geographical isolation

Continents form clusters

Italian Greyhound and Shetland Sheepdog show clear geographical subdivision: US populations form clusters distinct from their European counterparts. Within a single country, differential breeding strategies split show and working lineages in the same way.

Unverified parentage

What segregates unnoticed

Studbook entries rest on what was reported. Where parentage is not DNA-verified, a misassignment stays undetected – and with it the genomic share it introduced. It does not disappear: it is passed on and segregates unrecognised through the population, invisible in both the phenotype and the paperwork.

Sources

  • Boyko AR, Quignon P, Li L et al. (2010): A Simple Genetic Architecture Underlies Morphological Variation in Dogs. PLoS Biology 8(8):e1000451. doi:10.1371/journal.pbio.1000451
  • Lampi S, Donner J, Anderson H, Pohjoismäki J (2020): Variation in breeding practices and geographic isolation drive subpopulation differentiation, contributing to the loss of genetic diversity within dog breed lineages. Canine Medicine and Genetics 7:5. doi:10.1186/s40575-020-00085-9

What breed analysis shows in the individual dog

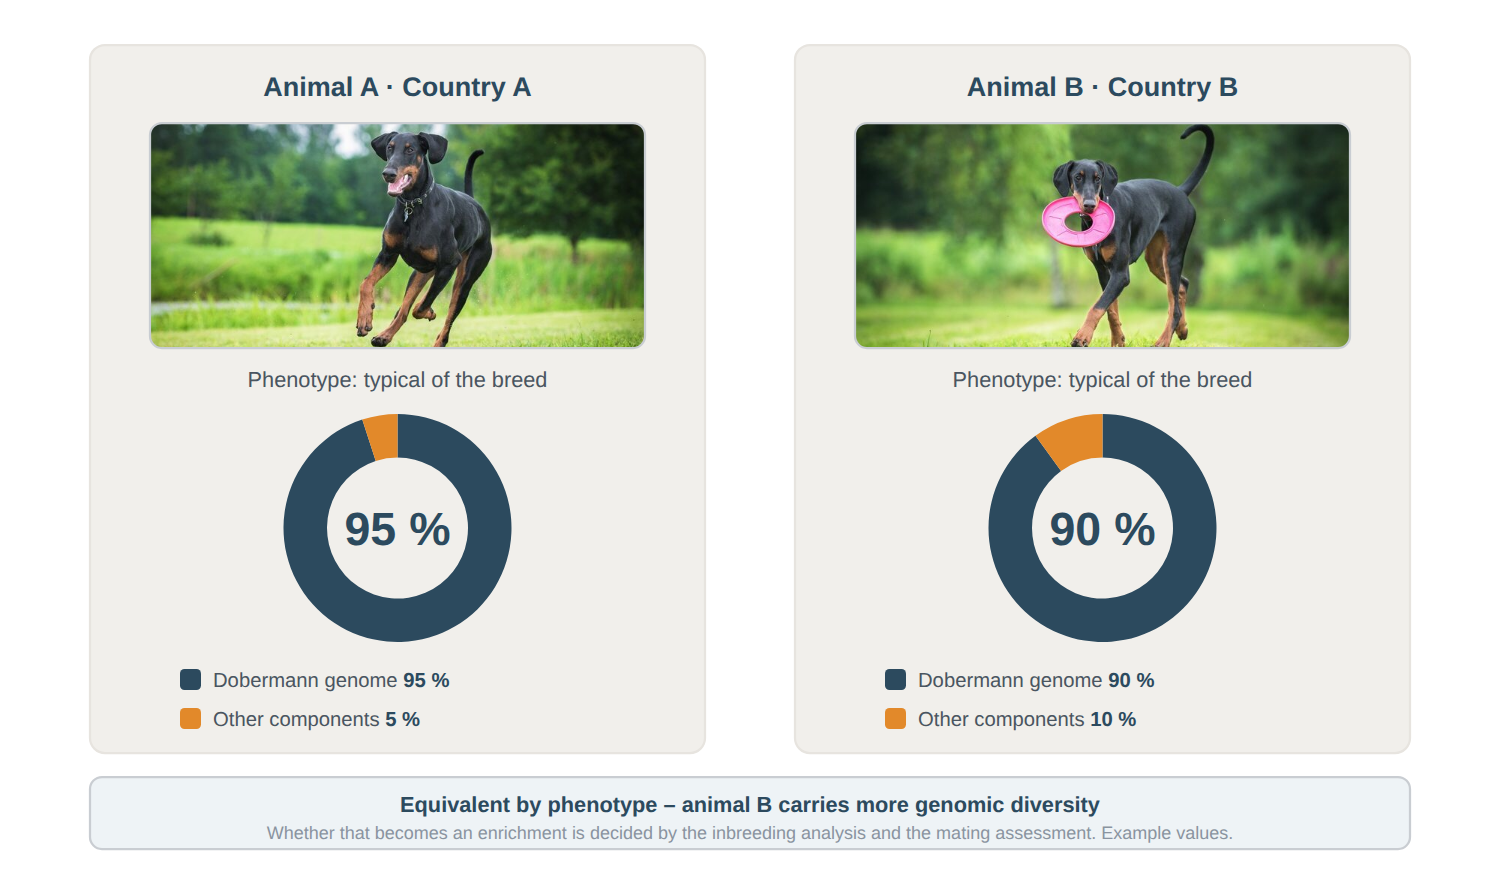
Breed analysis compares a dog’s genome against the reference background of its breed. It therefore answers more than „belongs or does not belong": it shows to what extent genomic components other than the breed-typical background are present.

Two dogs with a breed-typical Dobermann phenotype from different countries; the donut chart shows 95 percent Dobermann genome and 5 percent other components for animal A, and 90 percent and 10 percent for animal B.
Both dogs meet the breed standard – the difference lies in the genome. Example values.

By phenotype the two dogs are equivalent: each of them looks like a true Dobermann. Animal B, however, carries the greater genomic diversity and would therefore be an enrichment for your own population – provided the inbreeding analysis and the mating assessment do not argue against it.

Breed-typical

How much breed-defining share

The analysis quantifies to what extent the genomic components characteristic of the breed are present in the dog. A yes/no question becomes a graded statement – comparable between animals and traceable across generations.

Other components

What sits alongside it

It equally shows whether, and to what extent, genomic components are present that do not belong to the breed’s reference background. After a few generations such components are no longer visible in the phenotype – in the genome they remain detectable. No intent need lie behind them: they may have entered the population through a parentage record that was never verified.

Placement

Where the dog sits in the population

The result also shows how close the dog is to the reference background, or how clearly it departs from it. Deviation is not a flaw: it may point to a distinct line or to a subpopulation from another country – in other words, to exactly those dogs that are of interest for refreshing your own population.

Always assess inbreeding alongside

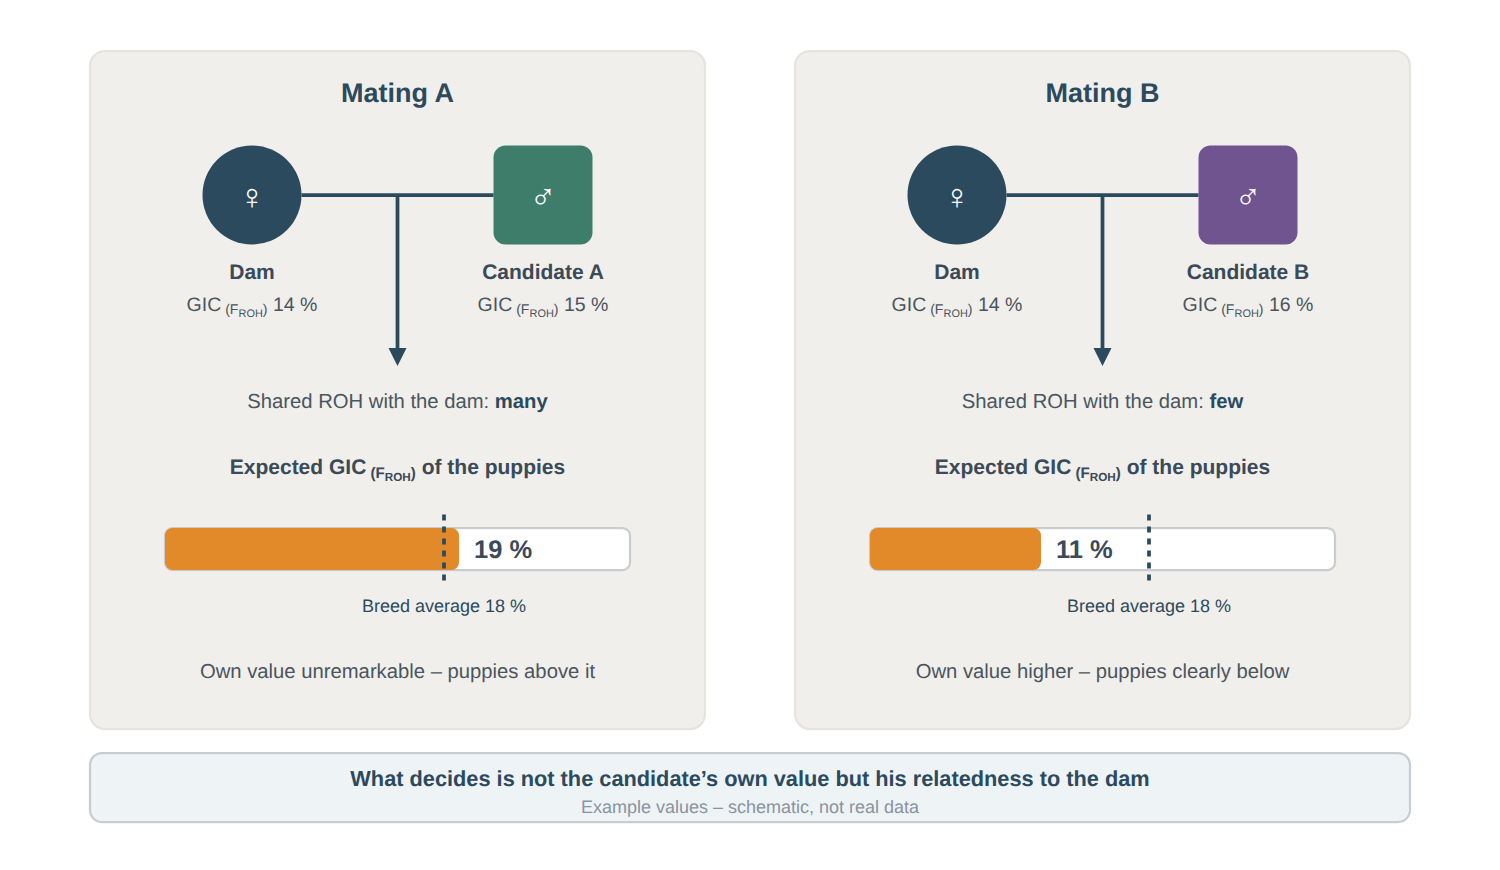
The starting point: a male from another population looks promising on individual assessment – both in his breed background and in his own inbreeding level.
How much of that actually reaches the puppies, however, is decided not by his own inbreeding value but by his relatedness to the intended dam. Every candidate assessment therefore has to include the question of what the mating does to the inbreeding level of the offspring.

The same dam, coloured identically in both matings, with two differently coloured candidates of similar own GIC: candidate A yields puppies at 19 percent, candidate B puppies at 11 percent expected GIC.
Candidate B is himself more inbred than candidate A – and still the better choice, because he shares less with the dam. Example values, schematic.
  1. His own value describes the candidate

    The genomic inbreeding coefficient GIC (FROH) states how much of the genome is homozygous in the candidate himself. That is a statement about him – on its own it says little about the planned mating.

  2. What the pair shares decides

    The expected inbreeding level of the puppies follows from what both parents share at the same positions. A candidate with a higher own value can therefore be the better choice if he has little in common with the dam.

  3. Preserve what is breed-typical

    The aim is not the lowest value at any cost. The breed-typical homozygous regions are to be preserved – what is lowered is homozygosity outside them. It is the genome-wide evaluation that makes this distinction possible.

Our DNA test for breed analysis: quality before breed count

Breed analyses are often advertised with the number of breeds they cover. Some providers promote more than 400 breeds – suggesting that almost every dog breed recognised worldwide can be told apart. The published data do not support that.

The current state of the evidence

What is documented 146 breeds that could be clearly delimited in the most comprehensive public analysis

The most comprehensive publicly available study covers 1,346 dogs from 161 breeds. 146 of them could be clearly delimited as a breed of their own; 15 could not. One large current reference panel distinguishes 114 breeds; its authors name missing reference data explicitly as a limit on their assignments.

For the remaining breeds of the roughly 400 recognised worldwide, no comparable published basis exists.

Why that is genomic closeness The more alike two breeds (subpopulations) are, the more reliable reference animals it takes

Many breeds sit genomically very close to one another: they share a common breeding history and differ only across small parts of the genome. The smaller that distance, the more reference animals it takes to differentiate two breeds reliably.

A list covering many breeds is therefore no mark of quality in itself. What counts is how many animals stand behind each individual breed – and whether a separation that is reported holds up at all.

Breed analysis at Generatio

We assess every dog examined at three levels of resolution, with respect to its composition and its genomic similarity:

Level 1: distinct breeds 164 breeds that are genomically clearly separable

The breed names are stated

These breeds have a genomic composition that yields a clear assignment against the reference data. Our result names the individual breed or breeds and their share of the total genome of the dog examined.

Level 2: combined breeds small genomic distance group of very closely related breeds

Breed group

Combined are breeds that sit so close genomically that they cannot be separated individually with confidence. The group itself is clearly delimited – against the distinct breeds and against the other breed groups.

Examples: Spitz breeds with their size varieties – bully type with Pit Bulls and Staffordshires – Molossers – wolves – French scenthounds – Coonhounds

Level 3: dogs resembling one another large genomic distance a specifically geographically formed background as the indicator

Mixed-breed populations

These groups comprise, for example, the local village dogs of various regions. They are mixed-breed dogs that have arisen from a wide range of local original and imported breeds and carry a genomic background of their own. At present we maintain 9 such pools: with a wide genomic spectrum, but a clear delimitation to the outside. Examples: Central Asian livestock guardian dogs – European livestock guardian dogs – Turkish livestock guardian dogs – African village dogs – East Asian village dogs – Latin American/Pacific village dogs – Middle Eastern/North African village dogs – Southeast Asian village dogs – South Asian village dogs

Note: our data material from South America, Asia and Africa is still being built up. As the number of these so far rather exotic references grows, individual breeds may be taken out of a pool and new pools may be added.

Sources

  • Parker HG, Dreger DL, Rimbault M et al. (2017): Genomic Analyses Reveal the Influence of Geographic Origin, Migration, and Hybridization on Modern Dog Breed Development. Cell Reports 19(4):697–708. doi:10.1016/j.celrep.2017.03.079
  • Sexton CL, Reichel C, Keyser A, Dunbar MD, Dog Aging Project Consortium, Ruple A (2025): Comparing owner reported and genetic breed identification reveals high concordance in a large cohort from the Dog Aging Project. Scientific Reports 15:30493. doi:10.1038/s41598-025-15095-5